Velocity vs. Time Graphs: Complete Guide for Students
Velocity vs. time graphs give us valuable information about the motion of a moving object.
The slope of velocity-time graphs provides us with average and instantaneous acceleration. The area under v-t graphs represents the displacement and distance traveled. Moments when the graph intersects the time axis indicate turning points.
In this article, we want to learn about these topics in detail, with some solved examples.
Velocity-Time Graphs: Introduction
Consider a moving object such that at any instant of time, you have its velocity (instantaneous velocity). If you plot these instantaneous velocities on a vertical axis, labeled as velocity, and time on the horizontal axis, you would create a so-called velocity-versus-time graph.
Therefore, a velocity-time graph represents the velocity of a moving body at any instant of time, with the vertical axis having SI units of m/s.
Like position vs. time graphs, such diagrams provide a snapshot of all the kinematic variables involved in the motion.
Velocity vs. Time Graphs: Slopes
Certainly, you learned in math class that the slope of a function in the x-y plane is defined as the change in the vertical axis over the change in the horizontal axis, or in mathematical terms: \[\text{slope}=\frac{\Delta y}{\Delta x}\] Replacing the y-axis with velocity (v) and x-axis with time (t), we obtain a v-t graph whose corresponding slope is defined as: \[\text{slope}=\frac{\Delta v}{\Delta t}\] What formula in physics does this slope remind you of? Average acceleration.
Recall that average acceleration in physics is defined as the change in velocity divided by the change in time: $\bar{a}=\frac{\Delta v}{\Delta t}$.
Combining these two expressions, we arrive at the following important result:
The slope of a velocity-time graph gives the acceleration of a moving object.
But which type of acceleration, average or instantaneous acceleration?
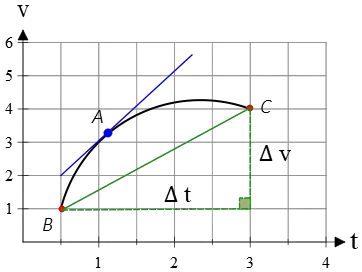
To answer this question, we must consider the difference between the slope of a line segment and that of a tangent line.
If we select two points on the velocity vs. time graph within a finite time interval, there is a finite difference between their corresponding velocity values.
In this case, the slope of the line segment between two points on a v-t graph is the average acceleration.
Now, consider the two points you selected are so close to each other that, in practice, they coincide. In this case, finite difference $\Delta v$ converts to infinitesimal change $dv$, and similarly for time $\Delta t \to dt$.
Simply put, the slope of the tangent line to the velocity-time graph gives us the instantaneous acceleration.
Keep in mind that when the velocity vs. time graph of a moving object is a straight line, the slope of a line segment in that interval equals the slope of the tangent line at each point there.
In the next example, we will see how to find slopes in a velocity-time graph.
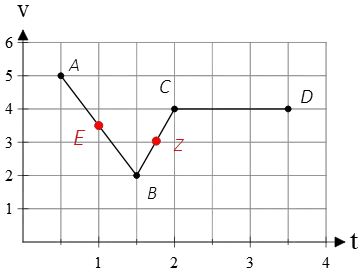
Example: Find (a) the slope of the line segment $AB$, $BC$, and $CD$
(b) And the slope of tangent lines at points $E$ and $Z$.
Solution: Slope is defined as the ratio of the difference in the vertical axis to the change in the horizontal axis.
(a) For the line segment $AB$, the starting point is (A) with coordinates $A(v=5,t=0.5)$, and the ending point is $B(v=2,t=1.5)$. The change in the vertical $\Delta v$ and horizontal $\Delta t$ axes are: \begin{gather*}\Delta v=v_B-v_A=2-5=-3\\\Delta t=t_B-t_A=1.5-0.5=1\end{gather*} Next, construct their ratio to find the slope in the interval $[t=0.5,t=1.5]$ \[\text{slope}=\frac{\Delta v}{\Delta t}=\frac{-3}{1}=-3\] The slope is negative.
Similarly, the slope of segment $BC$ is \[\text{slope}=\frac{\Delta v}{\Delta t}=\frac{4-2}{2-1.5}=4\]
Additionally, the slope of $BC$ is zero because there is no change in the vertical axis.
(b) Since the given graph is composed of straight lines, the slope of the tangent line equals the slope of the line segment in that interval.
Points $E$ and $Z$ lie in the segments $AB$ and $BC$, respectively, so their slopes are also $1$ and $-3$.
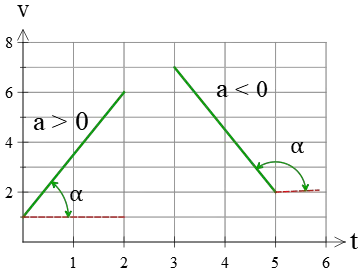
There is an important note about the sign of slopes in a velocity-time graph. When the straight line makes an acute angle with the positive $x$ axis, the slope is positive, and an obtuse angle results in a negative slope. This is shown in the figure below.
In the next example, we will obtain the average and instantaneous acceleration of a moving object using a v-t graph.
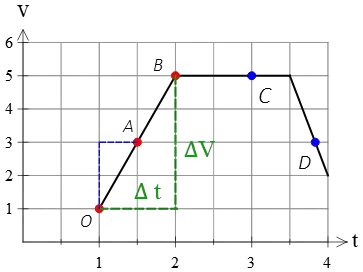
Example (1): The velocity of a moving car along a straight line as a function of time is depicted in the following graph. Find
(a) Average acceleration in the time interval $1\,{\rm s}$ to $2\,{\rm s}$.
(b) Average acceleration during the next 2 seconds.
(c) Instantaneous acceleration at points $A$, $C$, and $D$.
Solution: As mentioned, the average acceleration is the slope of the line segment joining two arbitrary points on the v-t graph, whereas instantaneous acceleration is the slope of a tangent line at a specific instant of time.
(a) First, locate the corresponding values of velocities in the given time interval: \begin{gather*} t=1\,{\rm s}\quad \to \quad v=1\,{\rm m/s}\\t=2\,{\rm s}\quad \to \quad v=5\,{\rm m/s}\end{gather*}
Next, by applying the definition of slope as the change in the vertical axis over the change in the horizontal axis, we have: \begin{align*}\text{slope}&=\frac{\text{vertical change}}{\text{horizontal change}}\\\\&=\frac{v_2-v_1}{t_2-t_1}\\\\&=\frac{5-1}{2-1}\\\\&=4\,{\rm m/s^2}\end{align*} Therefore, during time interval $[1\,{\rm s},2\,{\rm s}]$, the car's speed changes at a constant rate of $4\,{\rm m/s^2}$.
(b) As the graph shows, there is no change in the vertical axis, which is the same as the change in the car's velocity $\Delta v=0$. So, the slope in this time interval is zero, meaning the car's velocity does not change with time.
(c) The v-t graph in this time interval is a straight line, so the slope of the line segment between any two points equals the slope of the tangent line at each point in this interval.
To find the slope of the tangent line at point $A$ or the instantaneous acceleration at time $t=1.5\,{\rm s}$, select two arbitrary points in this interval and compute its slope.
One point is selected as $O$ and the other is $A$ itself. The slope of this line segment equals the slope of the tangent line at point $A$. \begin{align*}\text{slope}&=\frac{\text{vertical change}}{\text{horizontal change}}\\\\&=\frac{v_A-v_O}{t_A-t_O}\\\\&=\frac{3-1}{1.5-1}\\\\&=4\,{\rm m/s^2}\end{align*} As expected, the slope at point $A$ was equal to the slope of line segment $OB$.
Thus, as a general rule, keep in mind that in a straight-line velocity-time graph, average acceleration equals instantaneous acceleration.
Now, we want to find the instantaneous acceleration at point $C$. In this interval, the line segment is horizontal, so $\Delta v=0$ and the slope is zero. Therefore, at each point in the time interval of $[2\,{\rm s},4\,{\rm s}]$, the instantaneous acceleration is zero.
At point $C$, the situation is different. We don't have the value of time at this point, but we see that point $C$ lies on a straight line where the coordinates of the initial and final points are known. So, the slope between these two known points is \[\text{slope}=\frac{v_f-v_i}{t_f-t_i}=\frac{2-5}{4-3.5}=-6\,{\rm m/s^2}\] Therefore, the instantaneous acceleration at point $C$ is $-6\,{\rm m/s^2}$.
One of the important pieces of information that can be extracted from a velocity-time graph is the direction of motion. Next, we will find this direction by a velocity-versus graph.
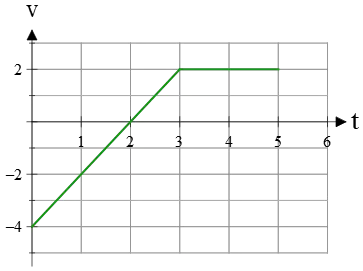
Example (2): The velocity vs. time graph for an object moving along a straight path is shown below. Discuss the direction of the motion throughout the path.
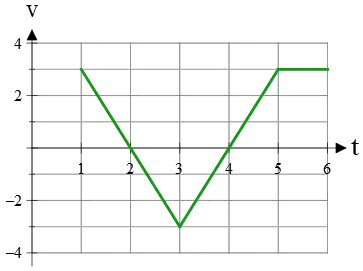
Solution: Recall that the direction of a motion is determined by the direction of its velocity. In a velocity-time graph, a negative velocity indicates movement toward the negative $x$-axis, while a positive velocity indicates movement along the $+x$-axis.
In the time interval, $1\,{\rm s}$ to $2\,{\rm s}$, all corresponding velocity values are positive, so the object is moving along the positive $x$-axis.
At $t=2\,{\rm s}$, the graph enters the negative values for velocity. At this moment, the object stops and changes its direction toward the $-x$-direction. Such moments are called turning points.
The graph lies entirely in the negative velocity range during $2\,{\rm s}$ to $4\,{\rm s}$. Therefore, in this interval, the object is moving along the negative $x$-direction.
Again, at $t=4\,{\rm s}$, the object enters the positive values for velocity, marking another turning point.
After this moment, the graph lies entirely in the positive values of velocity, indicating that the object's motion is along the positive $x$-direction.
In this example, we see that the turning points of a velocity-time graph occur when the velocity is zero $v=0$, and the direction of motion changes.
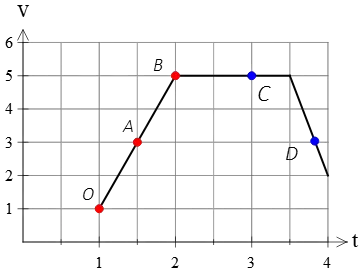
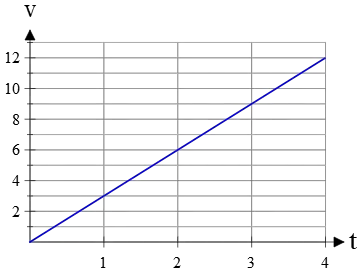
Example (3): Give a physical interpretation for a moving car having the following velocity vs. time graph.
Solution: Assume the car is initially moving along the positive $x$-axis.
As you can see, all graph points lie in the range of positive values of velocity, so the car retains its initial direction of motion along the positive $x$-axis.
For the first $2$ seconds of motion, the car increases its speed at a constant rate (constant acceleration) because the slope in this interval does not change.
Next, at the instant of $t=2\,{\rm s}$, the car maintains its speed at 5 m/s for the next 1.5 seconds along the same direction.
At the moment of $t=3.5\,{\rm s}$, the car starts to slow down its velocity over the next $0.5$ seconds to the final velocity of 2 m/s, still moving along the positive $x$-axis.
Example (4): Two cars are moving along a straight path with the following velocity vs. time graph. Both of them accelerate from 0 to 100 km/h in a time interval of 10 s. Compare the following for the two cars
(a) The average acceleration.
(b) The instantaneous acceleration.

Solution: The slope of a line segment between two arbitrary points in a v-t graph gives the average acceleration, while the slope of a tangent line at a particular point represents the instantaneous acceleration.
(a) The average acceleration is the change in velocity over the change in time elapsed. The graph shows (segment in green) that for both cars, these changes (vertical and horizontal) are the same, so the average accelerations of both cars are equal. \[\bar{a}_A=\bar{a}_B=\frac{100}{10}=10\,{\rm m/s^2}\]
(b) The instantaneous acceleration, which is the same as the slope of tangent lines to the v-t graph during this time interval for two cars, is shown by red lines.
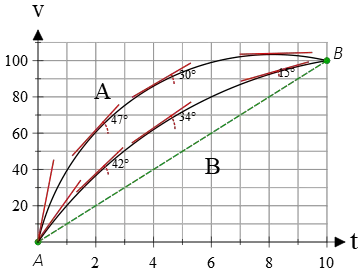
As you can see, initially the tangent to the car $A$ makes a larger angle than that of car $B$, so car $A$ starts its motion with a greater acceleration.
The angles of each tangent indicate the measure of instantaneous acceleration at that instant of time.
In the first 2 seconds of motion, the top curve is steeper with a larger angle, indicating a greater instantaneous acceleration.
At the moment of $t=4\,{\rm s}$, this trend changes, and the slope of the tangent for car $B$ becomes greater than that of car $A$ for the remaining 6 seconds of motion.
Hence, after the instant of 4 s, the instantaneous acceleration of car $B$ is greater than that of car $A$.
Velocity vs. Time Graphs: Description of Motion
In the next example, the various cases of motion that appear in a velocity-time graph are discussed.
Example (5): Describes each of the following velocity vs. time graphs.
(a) Three straight lines with positive slope.

The red line starts its motion at some positive initial velocity along the positive $x$-axis and increases it at a constant positive rate (positive slope = acute angle = positive acceleration)
The blue line has the same description of motion but starts at rest (initial speed is zero).
The green line describes the motion of an object that starts its movement at some negative velocity. This means that the object initially travels along the negative $x$-axis for $t$ seconds.
At that instant, its velocity becomes zero (red dot), and it turns back toward the positive $x$ axis (since after $t$, the velocities are positive)
(b) Two straight lines with negative slopes.

Solution: The straight lines make obtuse angles with the positive $x$-axis, indicating that their accelerations are negative.
The red line describes a motion where the object starts at some initial speed along the positive $x$-axis, decreases its speed at a constant rate over $t$ seconds, stops at that moment, reverses direction, and moves back toward the negative $x$-axis.
(c) Two horizontal straight lines.
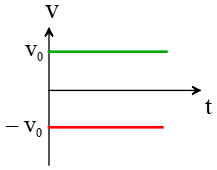
Solution: The green line represents an object moving away from the origin at a constant velocity toward the positive $x$-axis.
The red line represents a motion where the object moves away from the origin at a constant velocity toward the negative $x$-axis.
Velocity vs. Time Graphs: Area
Until now, we have learned how to find acceleration and the direction of a motion along a straight path using a velocity-time graph.
Another important piece of information that this graph provides is the distance traveled or the displacement of the moving object.
As a rule of thumb, the area under the velocity vs. time graph over a given time interval represents the displacement during that interval.
The proof of this rule involves calculus, which is beyond the scope of this article.
Example (6): The velocity-time graph of a runner is shown below. How far does the runner move during the first 3 seconds?
Solution: “How far” refers to the displacement of the runner. We know that the area under the velocity-versus-time graph gives the displacement during a particular time interval. Thus, the displacement is the area of the shaded triangle between $t=0$ and $t=3\,{\rm s}$.
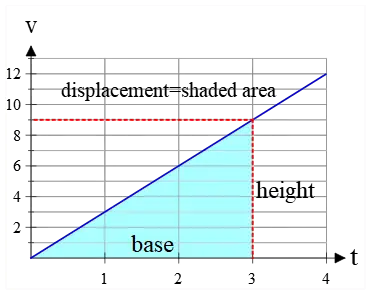
\begin{align*} \Delta x&= \text{triangle's area}\\\\&=\frac 12 \times base \times height\\\\&=\frac 12 \times 3\times 9\\\\&=13.5\quad {\rm m}\end{align*} Thus, the runner moves 13.5 meters in 3 seconds along the straight path.
Note that the area under a velocity-time graph has the SI units of meters ($m$).
In the next example, we will answer the question of how to find the distance using a velocity-versus-time graph.
Example (7): The velocity-time graph of a moving car along a straight path is shown below. In the time interval $t_1=0$ to $t_2=5\,{\rm s}$, find (a) displacement, (b) distance traveled.
Solution: The area under a velocity vs. time graph gives the displacement. However, note that displacement is a vector in physics, having both magnitude and direction.
As you can see, the total area in this problem consists of two areas, a blue triangle, and a yellow trapezoid.
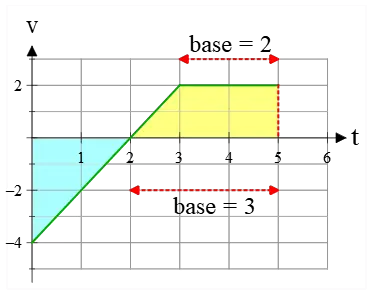
(a) The areas of a triangle and a trapezoid are calculated as follows: \begin{gather*}\text{triangle's area's}=\frac{b\times h}{2}\\\\ \text{trapezoid's area}=\frac{a+b}{2}\times h\end{gather*} Substituting the values gives: \begin{gather*}\text{triangle's area}=\frac{2\times (-4)}{2}=-4 \\\\ \text{trapezoid's area}=\frac{2+3}{2}\times (2)=5\end{gather*} Note that here the areas can be negative, in contrast to typical mathematical areas.
A negative area under a velocity-time graph indicates the direction of the displacement vector.
In this case, the negative area of the triangle indicates a net displacement toward the negative $x$-axis.
Hence, the total area, which is the algebraic sum of areas, represents the displacement. \[\text{displacement=total area}=(-4)+5=1\quad {\rm m}\]
(b) The absolute value of area under a velocity-time graph gives the distance traveled. \[\text{total distance}=|-4|+5=9\quad{\rm m}\]
Example (8): The velocity-time graph of a trip is shown below. Find the total displacement of the moving object.

Solution: The bounded area under a velocity vs. time graph gives the displacement. In this case, the bounded area is a colored trapezoid.
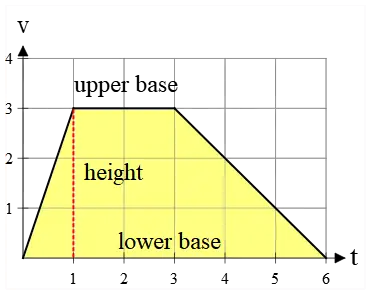
The upper base is 2 units and the lower base is 6 units. Its height is also 3 units. The area of a trapezoid is found as follows: \begin{align*} A=\frac{\text{upper base+lower base}}{2}\times height\\\\=\frac{2+6}{2}\times(3)\\\\=12\quad {\rm m}\end{align*}
Example (9): The velocity vs. time graph for a trip is shown below.
(a) Find the acceleration for each section.
(b) The total distance traveled from $5\,{\rm s}$ to $7\,{\rm s}$.
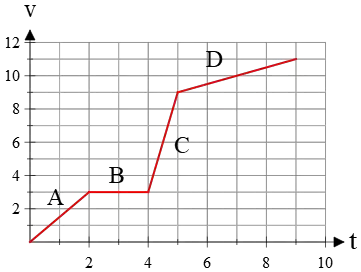
Solution: The slope of a velocity vs. time graph represents the acceleration of an object. The slope is the change in the vertical axis over the change in the horizontal axis.
(a) For segment $A$, the vertical change is $\Delta v=v_2-v_1=3-0=3\,{\rm m/s}$ and the horizontal change is $\Delta t=2-1=1\,{\rm s}$. Thus, the slope or acceleration is \[a_A=\frac{\Delta v}{\Delta t}=\frac 32\quad{\rm m/s^2}\] For section $B$, we have: \[a_B=\frac{v_2-v_1}{t_2-t_1}=\frac{3-3}{4-2}=0\] The slope or acceleration of segment $C$ is: \[a_C=\frac{v_2-v_1}{t_2-t_1}=\frac{9-3}{5-4}=6\quad{\rm m/s^2}\] Finally, the acceleration of section $D$ is: \[a_D=\frac{v_2-v_1}{t_2-t_1}=\frac{11-9}{9-5}=0.5\quad {\rm m/s^2}\]
(b) The area under a velocity-time graph gives the displacement vector, which can also be a negative value. The absolute value of this area gives the distance traveled in that direction.
The bounded area under this $v-t$ graph during the time interval $[5\,{\rm s},7\,{\rm s}]$, is a the colored area of a trapezoid
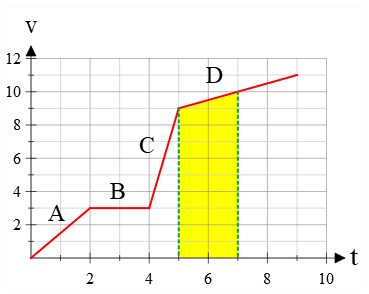
\begin{gather*} \text{displacement=trapezoid's area}\\\\=\frac{9+10}{2}\times (2)\\\\=19\quad {\rm m}\end{gather*} Thus, this object moves a distance of 19 meters along the direction of motion.
Note that the area of a trapezoid is found by using the formula: \[A=\frac{\text{upper base+lower base}}{2}\times height\]
Example (10): In the following velocity-time graph, find
(a) The acceleration for each section.
(b) The total displacement traveled in 7 s.
(c) The total distance traveled in 7 s.
(d) What is the displacement after 7 seconds?
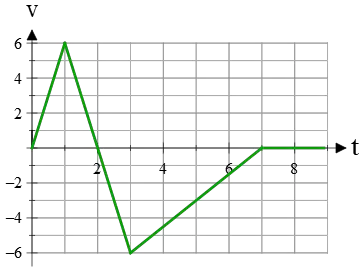
Solution: (a) The slope of a line on a velocity-time graph gives the acceleration of the object. Thus, the slope from 0 to 1 s is: \[\text{slope}=\frac{\Delta v}{\Delta t}=\frac{6-0}{1-0}=6\,{\rm m/s^2}\] For 1 s to 3 s, the slope or acceleration is: \[\text{slope}=\frac{v_f-v_i}{t_f-t_f}=\frac{-6-6}{3-1}=-6\,{\rm m/s^2}\] where subscripts $i$ and $f$ denote the initial and final points on the line segment. Finally, for 3 s to 7 s, the acceleration is: \[\text{slope}=\frac{v_f-v_i}{t_f-t_i}=\frac{0-(-6)}{7-3}=+1.5\,{\rm m/s^2}\]
(b) The bounded area under the velocity vs. time graph represents the displacement. This area can be negative since displacement is a vector in physics, and the sign of the area tells us the direction of displacement.
In this graph, in the time interval from 0 to 7 s, there are two bounded areas that have been colored.
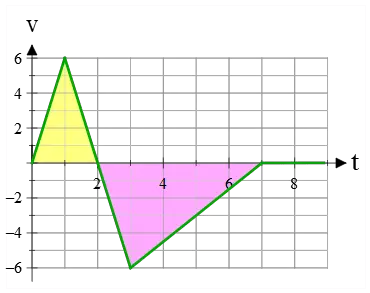
The areas of triangles are found as follows: \begin{align*}\text{yellow area}&=(1/2)(base\times height)\\&=(1/2)(2\times 6)\\&=6\quad {\rm m}\\\\\text{pink area}&=(1/2)(5\times (-6))\\&=-15\quad {\rm m}\end{align*} The algebraic sum of areas under a $v-t$ graph gives the total displacement during that time interval. So, \[\text{total area}=6+(-15)=-9\quad {\rm m}\] Thus, the total displacement of the object is 9 meters toward the negative $x$-axis.
(c) The absolute value of area under a $v-t$ graph during any time interval gives the distance traveled over that interval. In this case, the object has traveled a distance of 6 meters for 2 s, and 15 meters for the next 5 seconds. So the total distance traveled in 7 s is the sum of these distances: \[\text{total distance}=6+15=21\quad {\rm m}\]
(d) As the $v-t$ plot shows, after the instant of 7 s, the velocity is zero as time passes. In other words, after this moment, the object is at rest. So, its displacement is zero.
Summing Up:
In this comprehensive article, we explored the concepts of slopes and areas under a velocity vs. time graph. We discussed how to determine acceleration using the slopes and how to calculate displacement by analyzing the areas under the graph.
Key Takeaways:
- The slope of a line on a velocity-time graph provides a geometric interpretation of acceleration.
- The bounded area under a velocity-time graph represents the displacement of the object.
Author: Ali Nemati
Page Published: 8-18-2021
Last reviewed: Sep 27, 2024
© 2015 All rights reserved. by Physexams.com
AP® is a trademark registered by the College Board, which is not affiliated with, and does not endorse, this website.